GROUND HERE: COLLABORATIVE WORKS OF KEN MCCOWN
DESIGN AND RESEARCH: URBAN, TRANSITION AND ERGONOMIC/BEHAVIORAL
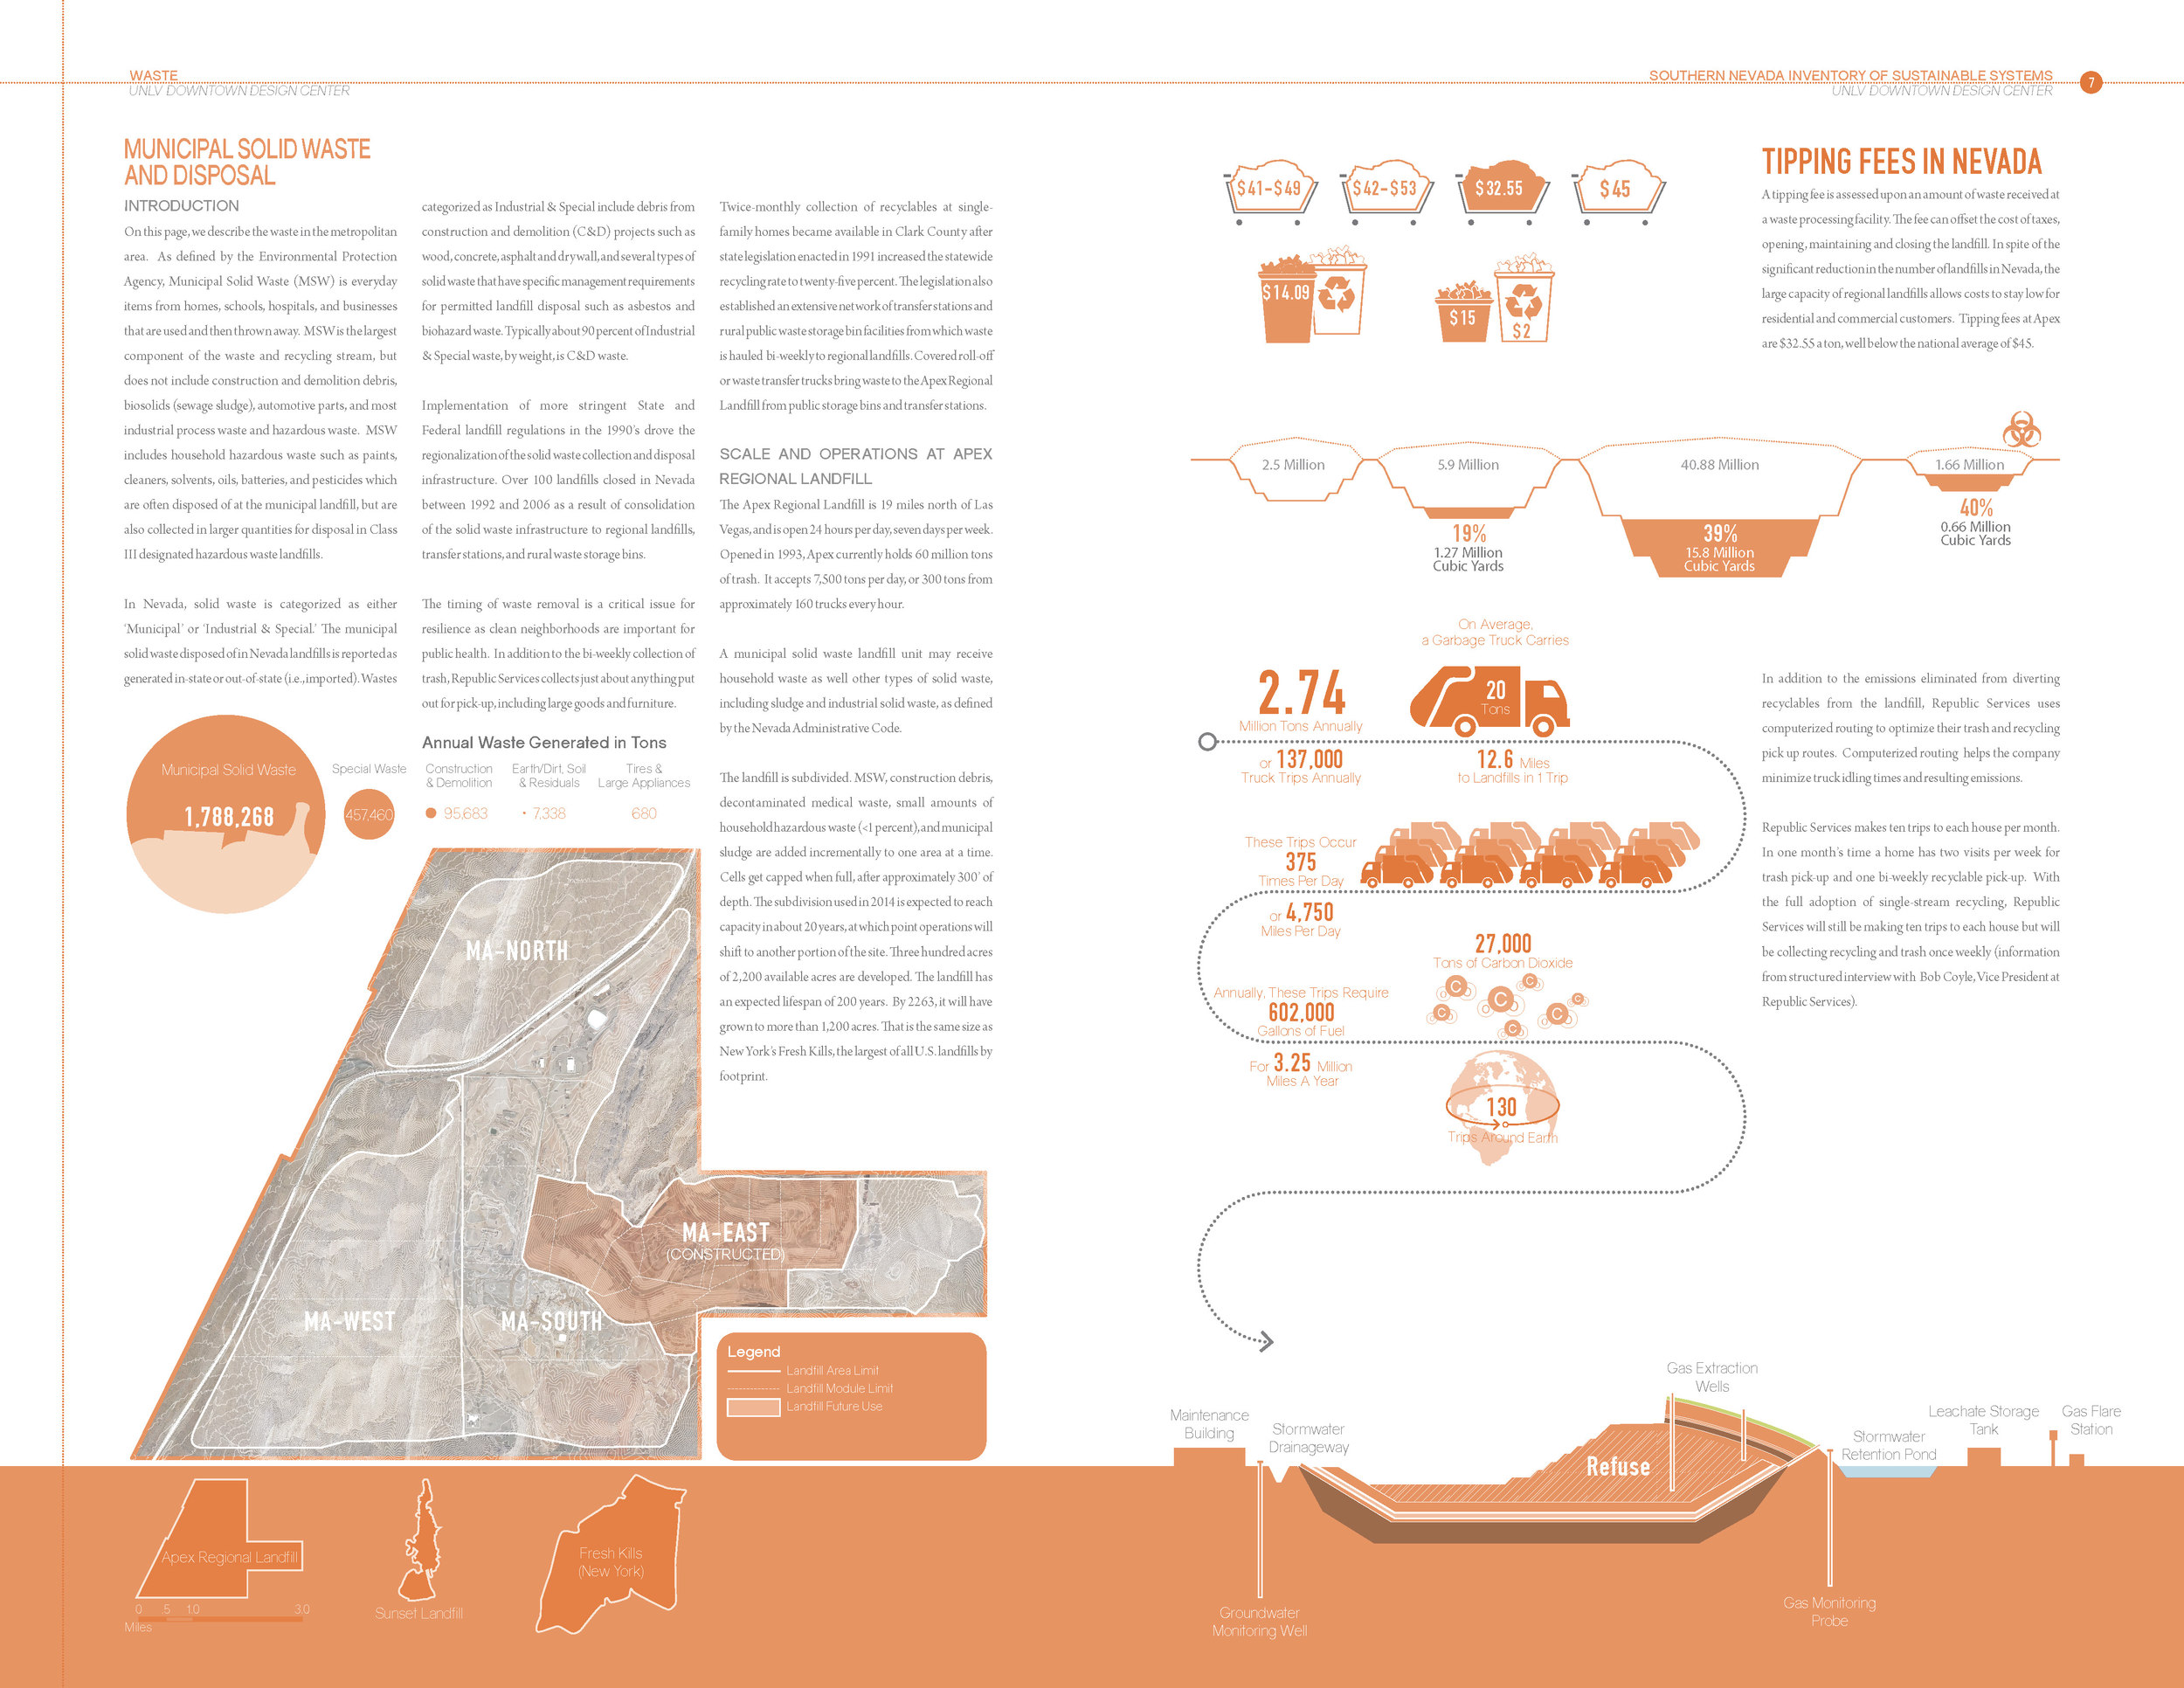
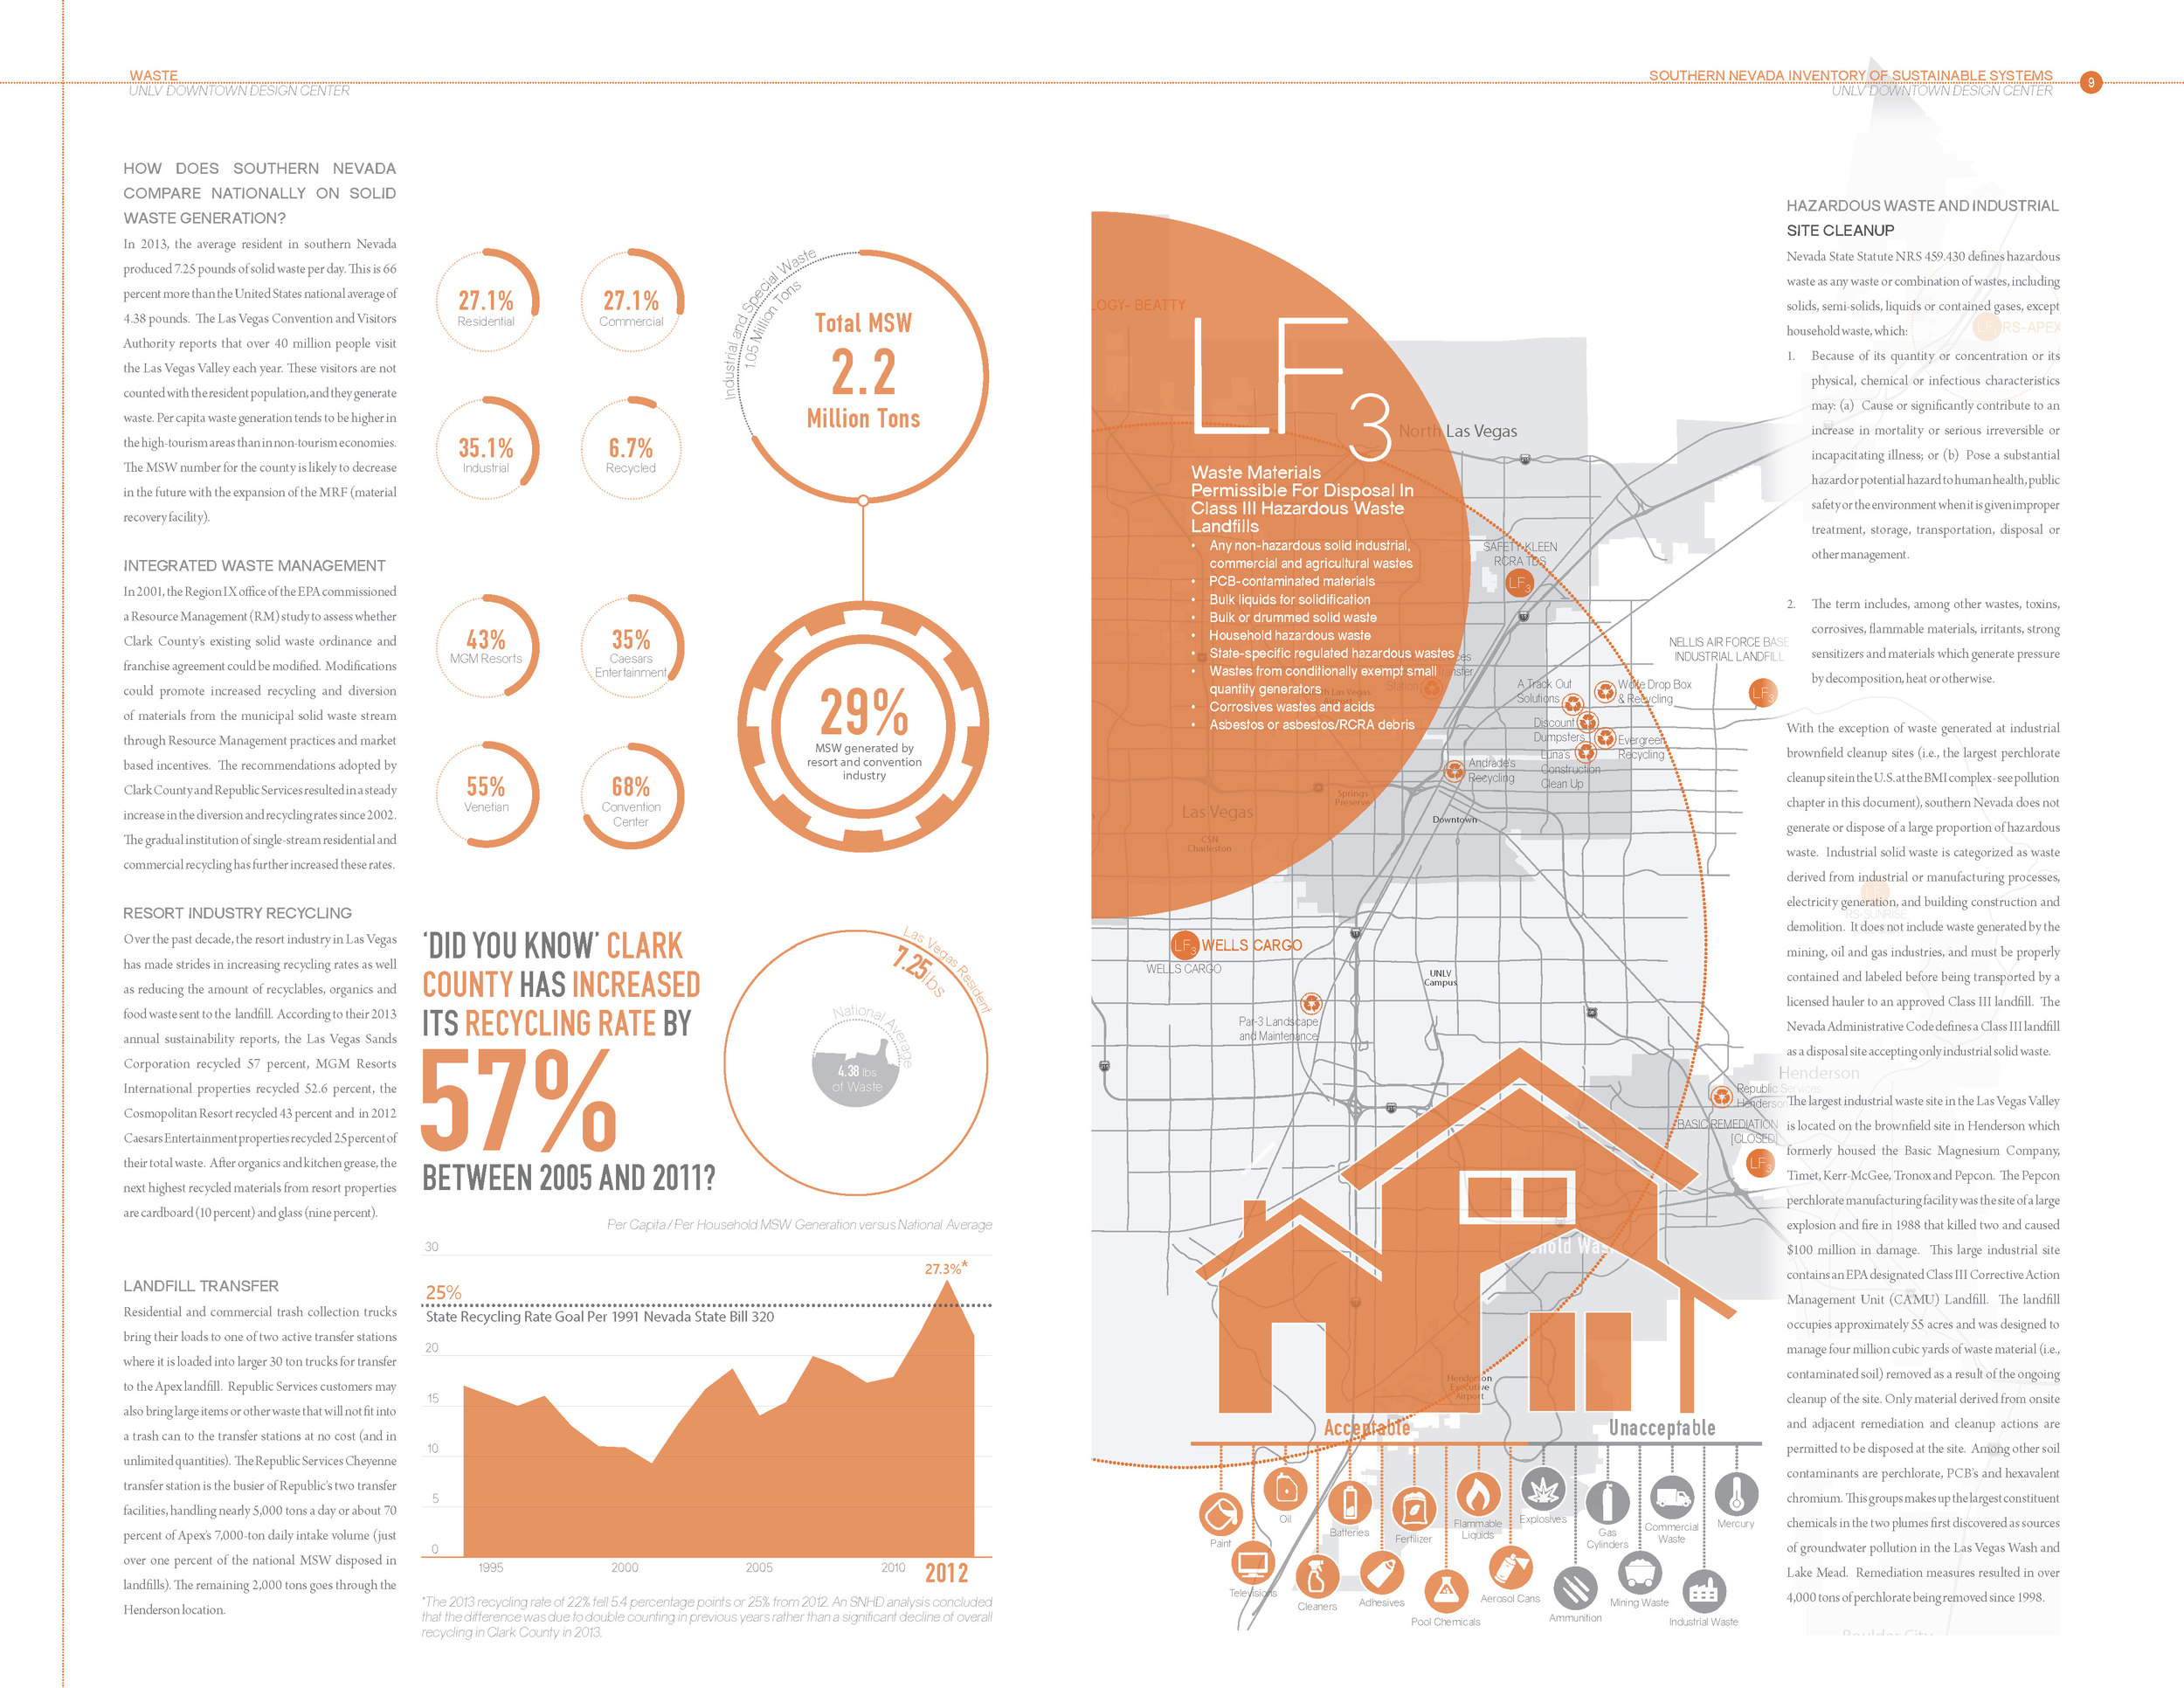
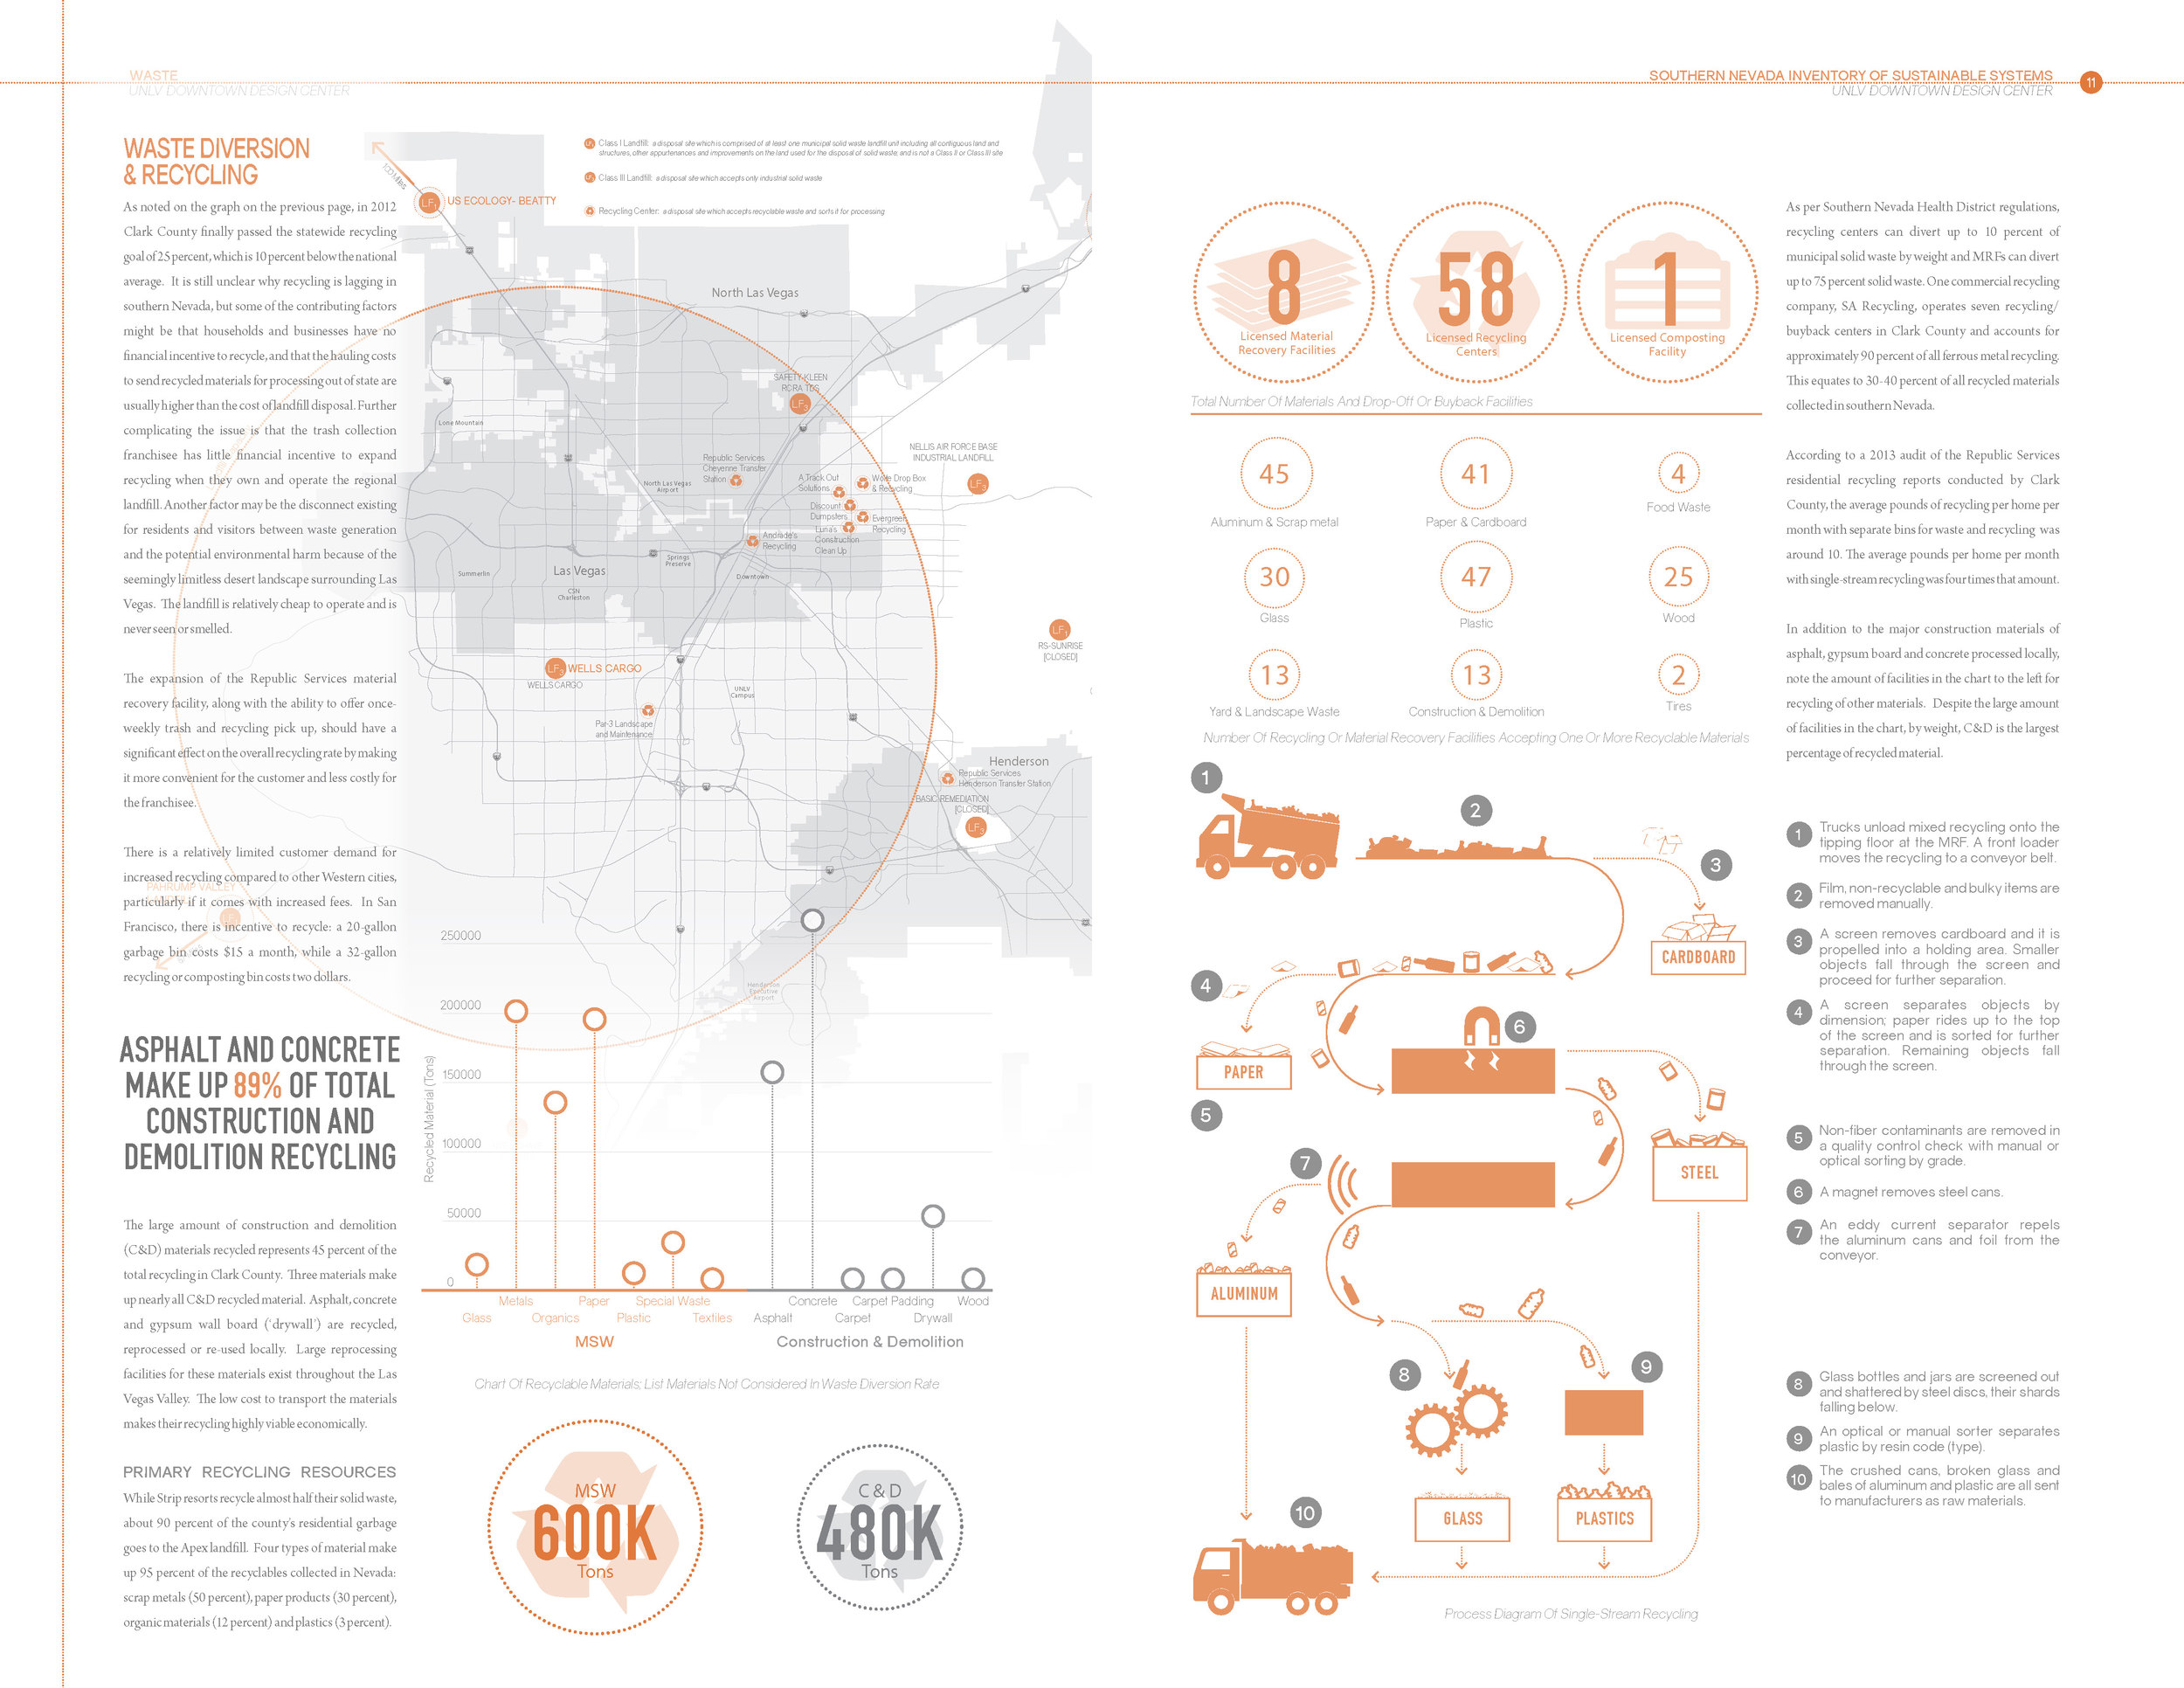
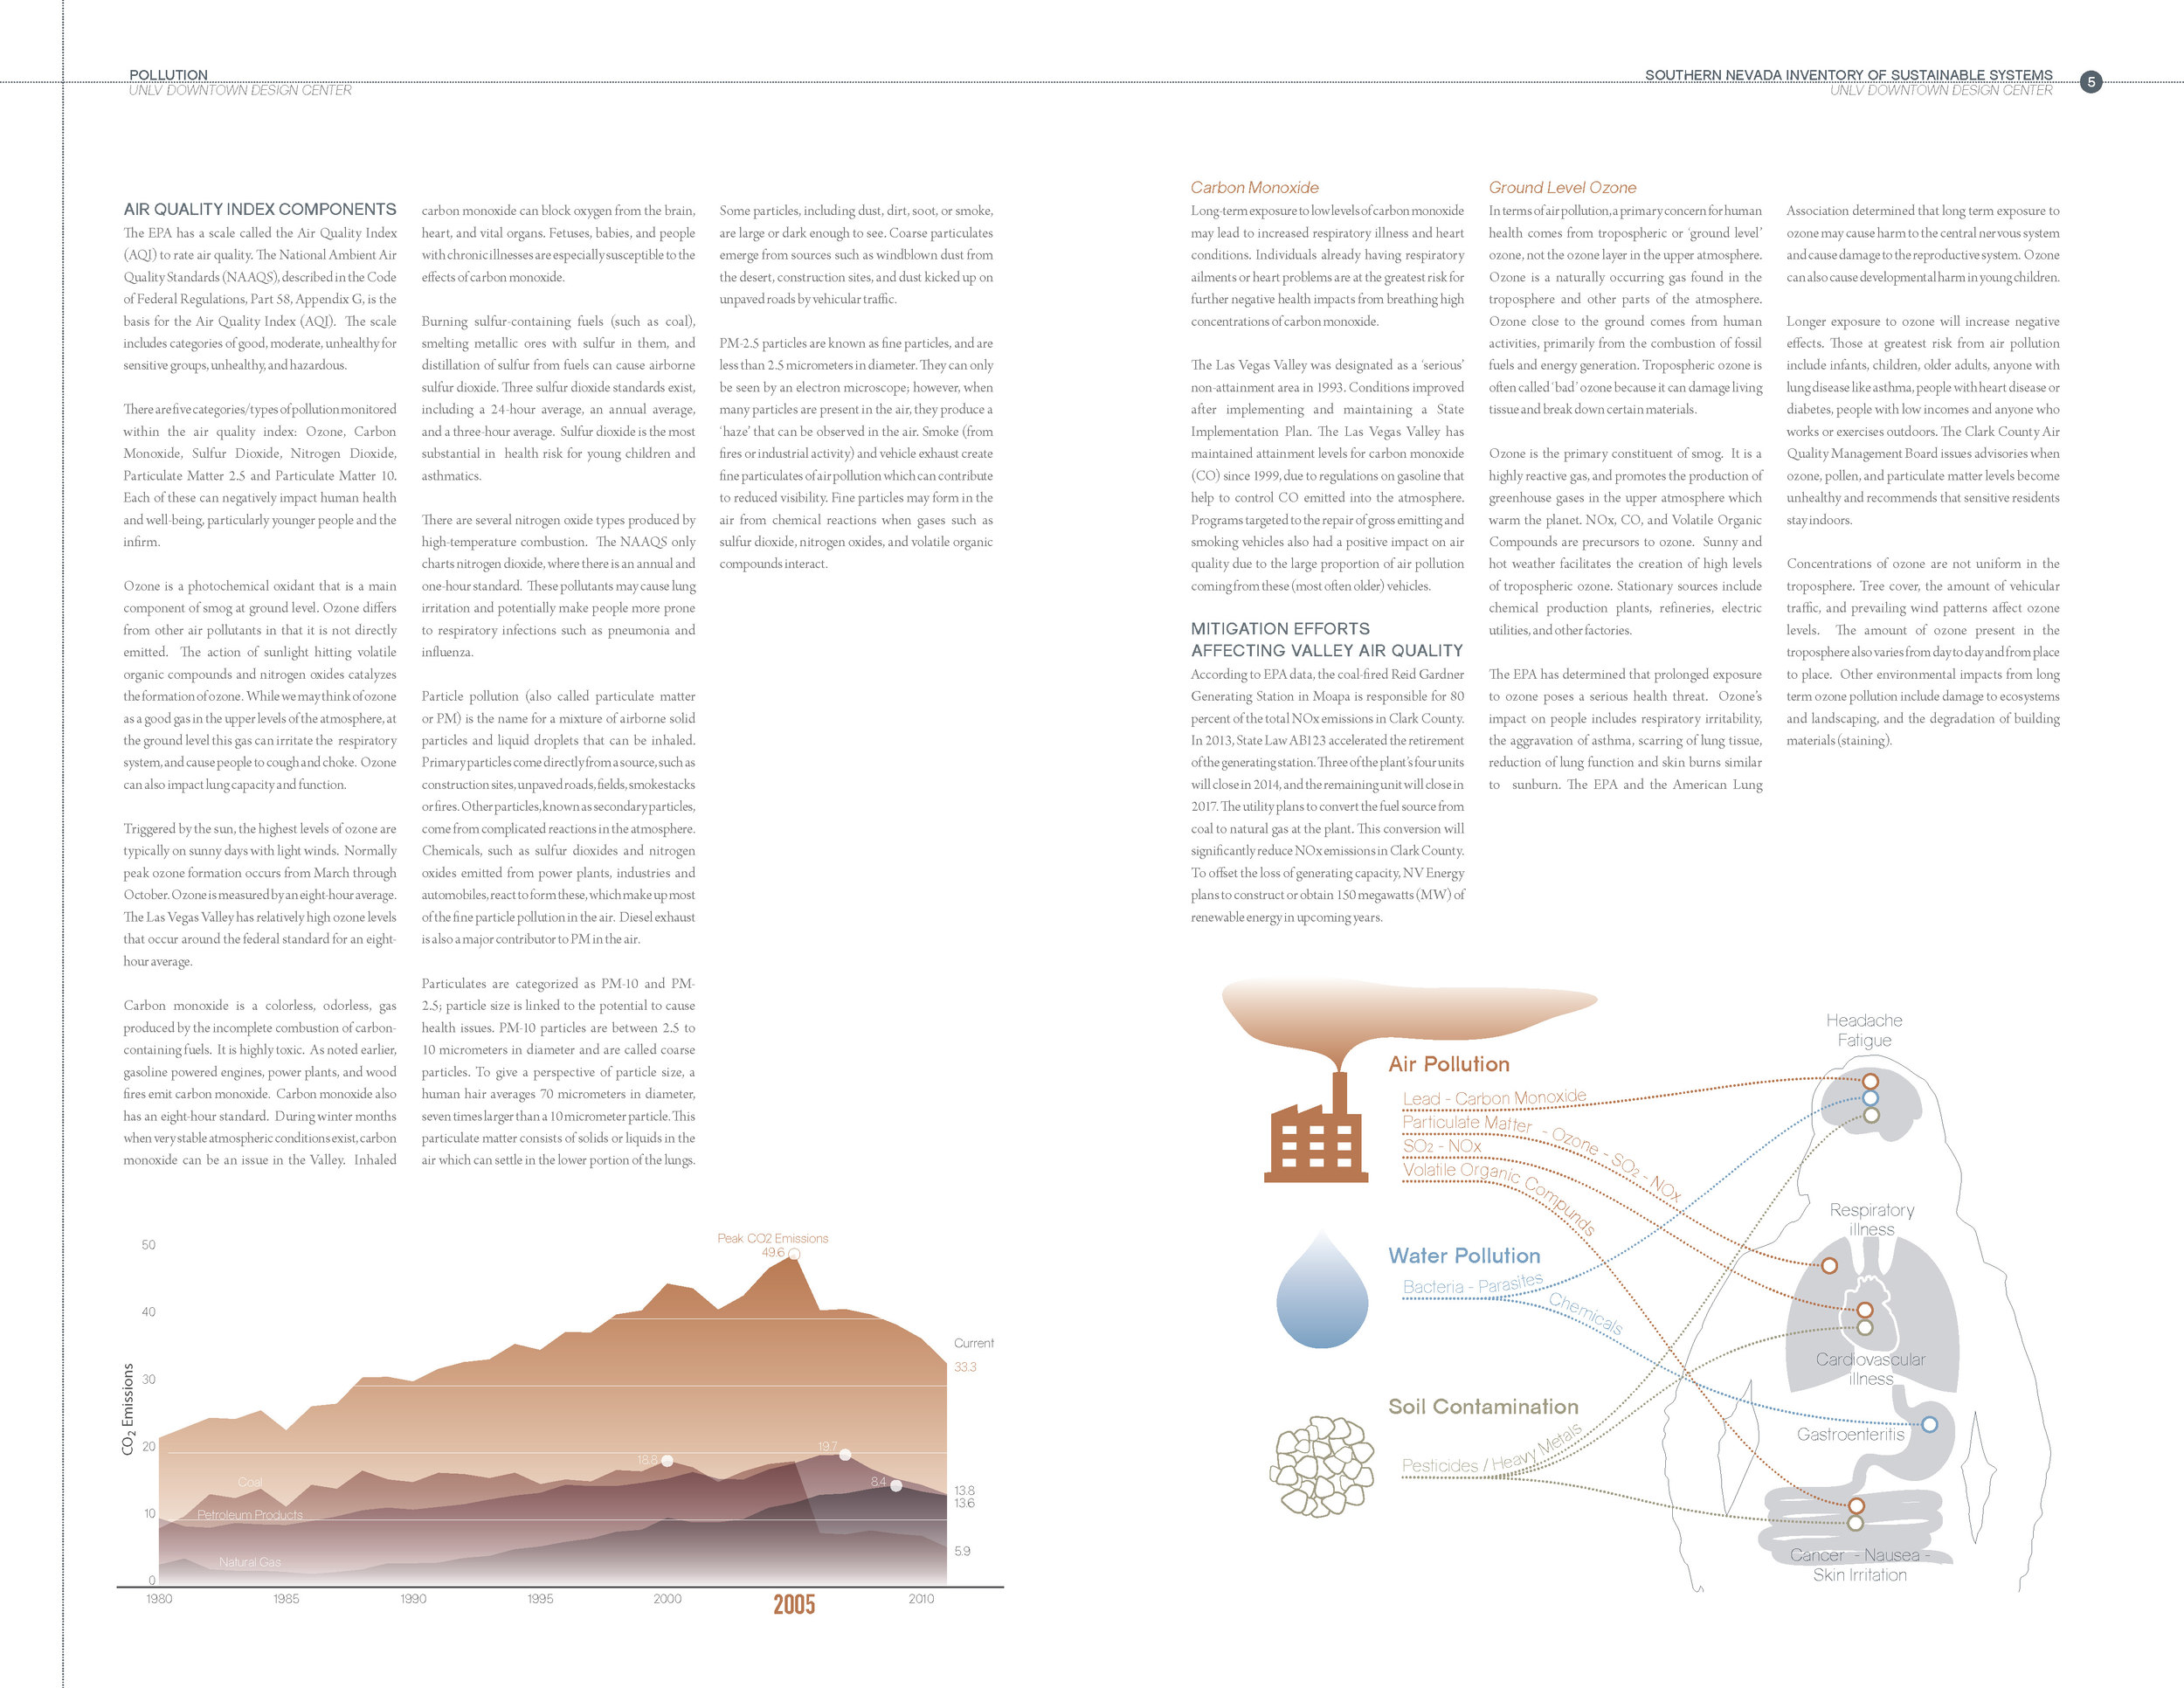
This is the water chapter from the Southern Nevada Inventory of Sustainable Systems, also known as the Las Vegas Sustainability Atlas. Las Vegas is incorrectly tied to the water loss in Lake Mead, and the resort industry is improperly noted as a prime culprit. The resort industry only uses about seven percent of the annual water use. The resort industry sees about 40 million visitors per year, the metropolitan population is two million. The metropolitan area is very efficient in its water use, returning almost two-thirds of its used water back into the lake each year. The only way Las Vegas will go completely dry is if the Colorado River runs dry.
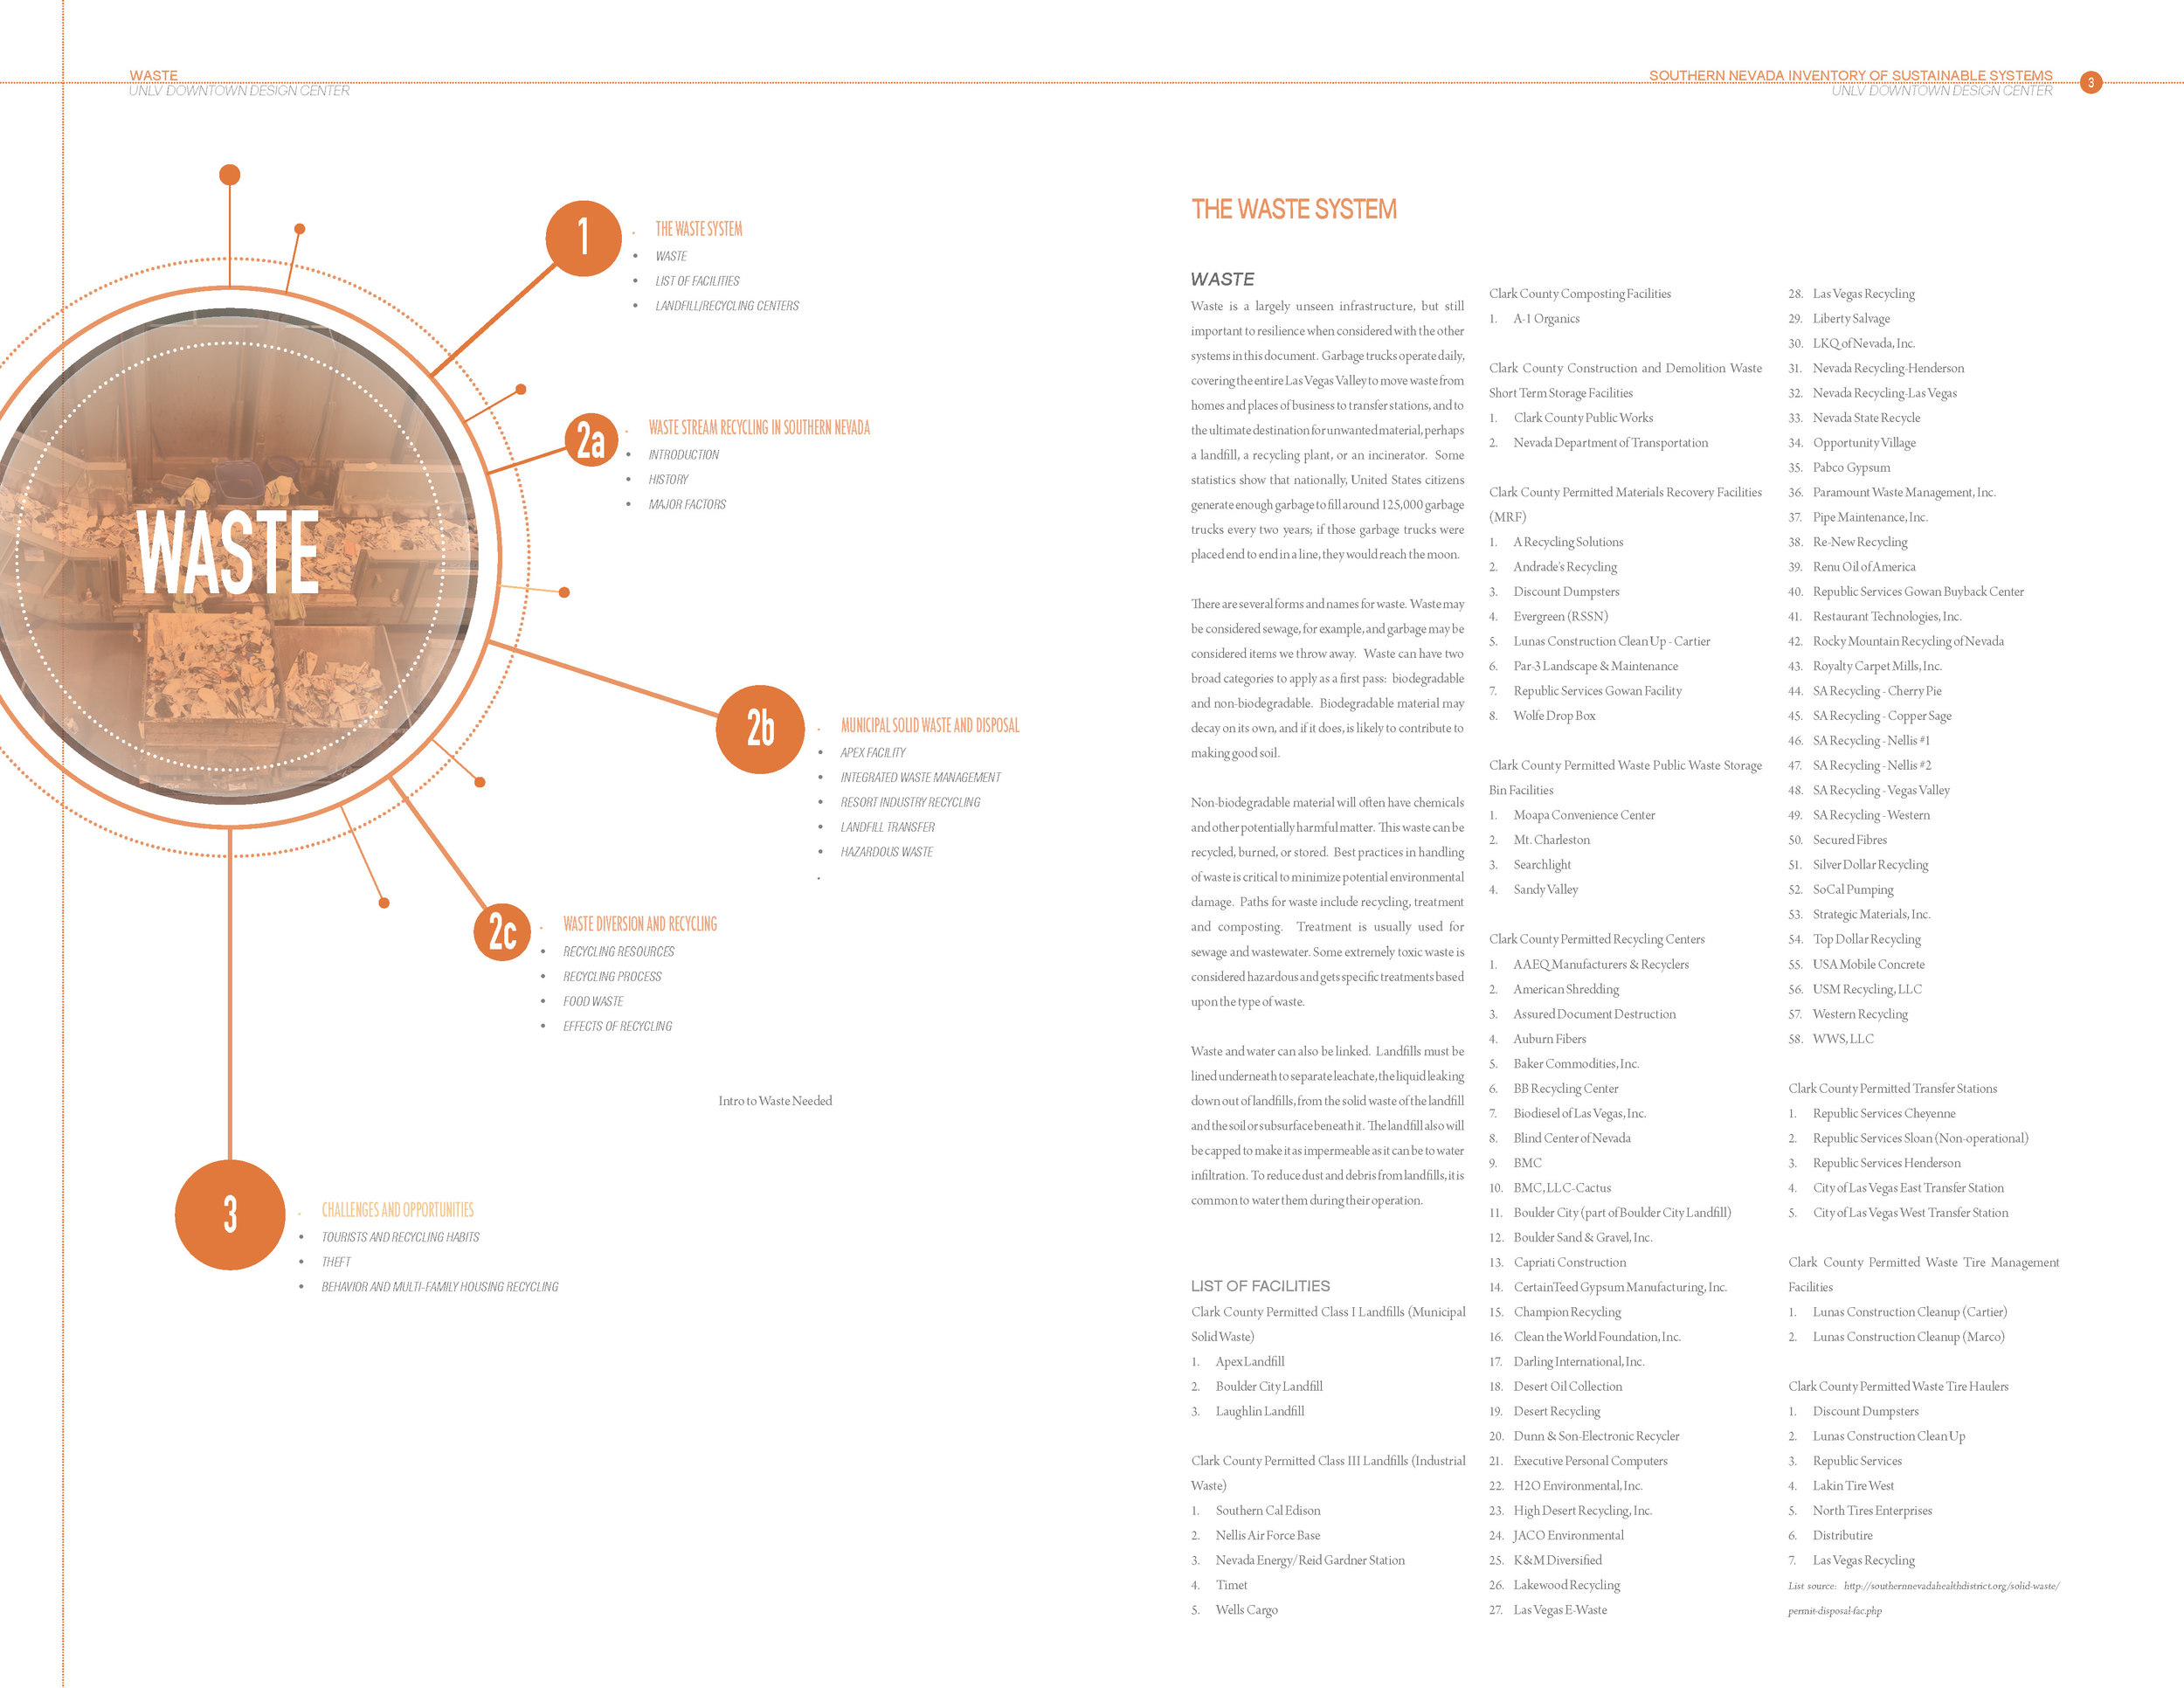
The introduction page. (click all images on page to enlarge)
The hydrology of the metro area - it is the driest in the world of its size, only getting three and a half inches of rain per year.
The water system is on 'steroids'. Lake Mead has added tremendous amounts of water to the system. Note the stoppage of groundwater drilling - wells are recharging.
The allocation of the Colorado River, Las Vegas has one of the smallest apportionments.
Water levels in Lake Mead are dropping, and a new intake valve is underway to be able to get water even if Lake Mead becomes a 'dead pool.'
A vast constructed wetland aids with water quality and recycling.
Water use in the valley is primarily homes, and their primary use is outdoor water use.
Challenges to the water system include pumping energy, climate change, and population growth.
Conservation measures make profound impacts on water use.
Las Vegas has almost a million acre-feet of real, semi-virtual and virtual water supply.
Locations of the future supply.
A process diagram of the food system.
Sources of Food in the Las Vegas Valley - the most ubiquitous is grocery stores(click image to enlarge).
Locations of farms in the Las Vegas Valley. (click image for larger view)
A map of food deserts in the Las Vegas Valley. (click image for a larger view)
Local and ethnic markets may reduce the food desert range. (click image for a larger view).
An inventory and analysis of areas with varying degrees of people with consistent hunger in the Las Vegas Valley. (click image to view larger)
A description of food pantries and their impacts on hunger in the Las Vegas Valley. (click image for bigger view)
Further descriptions of food pantries and hunger. (click image to view larger)
How school meals fit within the context of hunger in the Las Vegas Valley. (click image to enlarge)
How the government and non-profit sectors reduce impacts of food deserts in the Las Vegas Valley. (click image to enlarge)
The first maps explore the geography of food in the Valley, the image above explains affordability, and its disproportionate impact on the poor.
Bus routes and bus stops directly correlate with low wage jobs and fast food stores. It is likely those that cannot afford food shop for fast food.
A narrative about energy in the food system. The cost of energy correlates strongly and impacts food prices.
In addition to energy, projected trends in climate change and drought could dramatically increase food prices. (click image to enlarge)
People eat the same food, but in different economic classes, there is a large degree of separation in nutritional value. (click image to enlarge)

The distances different economic classes travel to get food varyThe high income group has the capacity to graze the valley to find the best food.
School gardens are a primary way residents of the Valley are diversifying the local food system. There are more schools now in the Valley doing this.
In addition to school gardens, food hubs are another way to grow urban agriculture and access to local, healthy food in the Las Vegas Valley.

Slideshow, click for images to move.


Slideshow, click on images to move to the next slide